Accounting concepts
How to read a profit and loss statement as an owner
Read a profit and loss statement top to bottom, from net sales and gross margin to net income, and compare two periods to see what changed and why.
By TNas · · 7 min read
To read a profit and loss statement, start at the top with net sales, subtract the cost of what you sold to get gross profit, and subtract operating expenses to get operating income. Then account for interest and other items to reach net income at the bottom. Then compare each line with an earlier period as a percentage of sales. That comparison, more than any single number, tells you what changed in the business.
A profit and loss statement (P&L) is the owner-friendly name for the income statement. OpenStax's Principles of Finance describes it as a report of a firm's performance over a specific period of time. That last part matters: a P&L covers a month, a quarter or a year, while the balance sheet is a snapshot of a single date.
A sample P&L to read along with
The walkthrough uses a fictional home-goods shop, Cedar and Pine, with fictional figures. It sells products it buys from suppliers, so its P&L has a cost of goods sold line. A service business reads the same way, usually without that line.
| Cedar and Pine, P&L | Q3 2026 | Q3 2025 |
|---|---|---|
| Sales revenue | $120,000 | $100,000 |
| Less: sales returns and allowances | (2,000) | (1,500) |
| Net sales | 118,000 | 98,500 |
| Cost of goods sold | (70,800) | (54,175) |
| Gross profit | 47,200 | 44,325 |
| Wages expense | 22,000 | 20,000 |
| Rent expense | 6,000 | 6,000 |
| Advertising expense | 4,500 | 2,000 |
| Utilities expense | 1,200 | 1,100 |
| Depreciation expense | 800 | 800 |
| Supplies and other expenses | 1,700 | 1,425 |
| Total operating expenses | 36,200 | 31,325 |
| Operating income | 11,000 | 13,000 |
| Interest expense | (400) | (500) |
| Net income | 10,600 | 12,500 |
Sales grew by about 20%, yet net income fell. The five steps below show how to find out why.
Step 1: Start with net sales, not gross sales
The top line is what customers were billed. Returns, allowances and sales discounts reduce it to net sales, the revenue the business actually keeps. OpenStax's chapter on multi-step income statements shows net sales as sales minus sales discounts and sales returns and allowances.
Two questions to ask here:
- Is revenue recorded when earned? Under the accrual basis, a sale counts in the period it is earned, even if the customer pays later. If your books follow the cash basis, revenue shows up when money arrives, and a big late payment can make one month look unusually strong.
- Are returns growing? Cedar and Pine's returns rose from $1,500 to $2,000. That is still under 2% of sales, so it is not the story here, but a rising returns line can signal a product or quality problem.
The revenue recognition lesson explains when a sale belongs in a period.
Step 2: Check cost of goods sold and gross profit
Cost of goods sold (COGS) is what the products you sold cost you. It is an expense only when the item sells; unsold stock stays on the balance sheet as inventory. In a perpetual inventory system, each sale produces two entries: one for the revenue and one moving the item's cost from inventory to COGS.
| Account | Debit | Credit |
|---|---|---|
| Sell a lamp for $90 cash | ||
| Cash | $90.00 | |
| Sales Revenue | $90.00 | |
| Record the lamp's $54 cost | ||
| Cost of Goods Sold | $54.00 | |
| Inventory | $54.00 | |
Net sales minus COGS is gross profit, sometimes called gross margin. As a percentage of net sales it is the gross margin percentage, which OpenStax computes as net sales minus cost of goods sold, divided by net sales.
| Q3 2026 | Q3 2025 | |
|---|---|---|
| Gross profit | $47,200 | $44,325 |
| Gross margin % | 40.0% | 45.0% |
This is the first clue. Each dollar of sales now leaves 40 cents to cover everything else, down from 45 cents. At last year's 45% margin, this year's $118,000 of net sales would have produced $53,100 of gross profit, or $5,900 more. Common causes are supplier price increases that weren't passed on, heavier discounting, a shift toward lower-margin products, or inventory shrinkage. The sibling post on gross margin vs markup shows how a pricing formula mix-up can cause it too.
Step 3: Read operating expenses as a share of sales
Operating expenses are the costs of running the business that aren't part of the product itself: wages, rent, advertising, utilities, depreciation and the like. In dollars, almost every line went up, which is normal for a business that grew. The useful view is each line as a percentage of net sales, which OpenStax's Principles of Finance calls common-size analysis.
| Line, % of net sales | Q3 2026 | Q3 2025 |
|---|---|---|
| Wages expense | 18.6% | 20.3% |
| Rent expense | 5.1% | 6.1% |
| Advertising expense | 3.8% | 2.0% |
| Total operating expenses | 30.7% | 31.8% |
Seen this way, wages and rent actually became more efficient: they grew more slowly than sales. Advertising more than doubled in dollars, from $2,000 to $4,500. Whether that was a good trade depends on how much of the sales growth it produced, which the P&L alone can't tell you. Overall, operating expenses fell as a share of sales, so they are not the main cause of the drop in profit. The gross margin is.
Watch for lines that don't belong. Equipment purchases should be on the balance sheet with only depreciation on the P&L, and loan principal payments should reduce the loan, not appear as an expense. The capitalizing fixed assets lesson covers the first; straight-line depreciation shows how the $800 a quarter is calculated.
Step 4: Find operating income, then net income
Operating income is gross profit minus operating expenses. OpenStax's Principles of Finance describes it as showing how profitable the firm's daily operations were as a whole. Cedar and Pine's fell from $13,000 to $11,000.
Below operating income come items that aren't part of day-to-day selling, such as interest expense on a loan or a gain on selling old equipment. Interest dropped from $500 to $400, which fits a loan balance that is being paid down.
Net income is the bottom line: everything earned minus everything spent to earn it during the period.
| Q3 2026 | Q3 2025 | |
|---|---|---|
| Net income | $10,600 | $12,500 |
| Net margin (net income ÷ net sales) | 9.0% | 12.7% |
So the full answer is: sales grew about 20% and operating costs grew more slowly, but gross margin fell by five points. Had the margin held at 45%, gross profit would have been $5,900 higher and net income would have reached $16,500. Instead it fell by $1,900, about 15%.
Step 5: Compare periods the right way
A single P&L tells you very little. Comparisons make it useful, and a few rules keep them fair:
- Compare like periods. This quarter against the same quarter last year removes seasonal swings. Month against previous month is useful for spotting sudden changes.
- Use percentages of net sales, as in Step 3, so a bigger or smaller period doesn't distort the picture.
- Look for one-off items. A large repair, a write-off or a catch-up entry from a prior month can make one period look worse than the business really is.
- Make sure the books were closed the same way. If one month includes adjusting entries for accrued wages and prepaid insurance and another doesn't, the comparison is unreliable. The month-end close guide lists the adjustments to make every period.
The IRS notes on its recordkeeping page that good records help you monitor the progress of your business and prepare your financial statements. A P&L is only as reliable as the reconciled books underneath it.
What the P&L does not show
Three things owners often expect to see on a P&L are not there:
- Cash. Profit is not the bank balance. Customers who haven't paid, inventory sitting on shelves and loan principal payments all use cash without touching net income. The sibling post on profit vs cash flow works through a full example.
- Owner draws. Money the owner takes out is recorded in owner drawings, an equity account, not as an expense. A healthy P&L can coexist with an owner taking out more than the business earns.
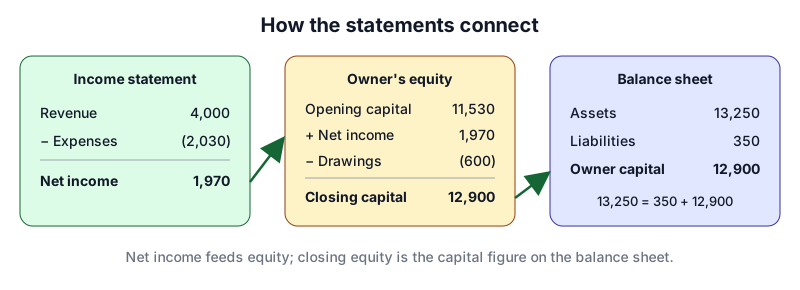
- Assets and debts. What the business owns and owes is on the balance sheet. Net income for the period flows into owner's equity there, as the diagram below shows.
Frequently asked questions
Is a profit and loss statement the same as an income statement?
Yes. "Profit and loss statement," "P&L," "income statement" and "statement of operations" are names for the same report: revenue and expenses for a period, ending in net income or net loss.
What is a good net profit margin?
It depends heavily on the industry and the business model, so there is no single target. The most useful benchmark for an owner is the business's own trend: is the margin stable, rising or falling, and why?
Why does my P&L show a profit when I have no money?
Usually because cash went somewhere the P&L doesn't show: unpaid customer invoices, inventory purchases, loan principal, equipment or owner draws. Compare the P&L with the balance sheet and the basic cash-flow view to find it.
A statement is only as reliable as the records behind it; see single-entry vs double-entry bookkeeping.
What to practice next
Reading a P&L gets faster once you've built a few. Try the income statement practice set to prepare statements from account balances, then the financial statement classification exercises to sort accounts between the P&L and the balance sheet.
Sources
- Principles of Accounting, Volume 1, 6.6 Describe and Prepare Multi-Step and Simple Income Statements for Merchandising Companies — OpenStax
- Principles of Finance, 5.1 The Income Statement — OpenStax
- Recordkeeping — IRS
Educational content for US small-business bookkeeping, not tax, legal or accounting advice. Example businesses and figures are fictional. See our editorial policy for how we write and correct content.